
The inventory turnover ratio measures how many times a business sells and replaces its stock during a given period, usually a year. It is one of the most direct indicators of how well purchasing, demand planning, and sales actually line up. Businesses that keep the number healthy manage stock with precision and control: enough inventory to protect service levels, but not so much that cash sits idle on warehouse shelves.
Let’s define the metric, walk through the formula with worked examples, explain what counts as a good result across industries, and lay out practical steps to improve it.
TL;DR
- Turnover measures stock velocity: how many times inventory is sold and replaced in a period. The standard way to calculate inventory turnover is to divide cost of goods sold (COGS) by average inventory.
- A higher ratio usually signals strong sales and lean stock control, though an extremely high number can point to understocking and missed orders.
- A lower ratio often points to overbuying, fading demand, or slow-moving SKUs that trap working capital and inflate storage costs.
- Benchmarks vary widely by industry. Many product businesses target 5 to 10 turns per year, while grocery runs far higher and luxury goods far lower.
- Improvement comes from operational discipline: sharper forecasting, deliberate reorder points, SKU segmentation, and real-time visibility into stock.
What Is The Inventory Turnover Ratio?
The inventory turnover ratio is a financial efficiency metric that shows how many times a company sells through and replenishes its inventory over a specific period. The result is expressed in “turns”: a ratio of 6 means the business sold and replaced its average stock six times during the year.
In other words, inventory turnover is the pace at which stock converts into sales. That pace matters because inventory is usually one of the largest assets on a product company’s balance sheet.
For every unit sitting in storage, there is:
- capital tied up,
- space occupied,
- insurance,
- shrinkage,
- a growing risk of obsolescence.
💡 The faster stock moves, the less of that cost accumulates per unit sold.
The metric is only as reliable as the stock records behind it, which is why accurate counts and real-time inventory visibility matter as much as the math done afterwards. Finance teams review the ratio as a working-capital measure; operations teams treat it as a core KPI alongside fill rate, order accuracy, and days sales of inventory.
Partnering with Nimbl gives your team the real-time inventory control and fulfillment discipline needed to make the ratio worth trusting.
Get Expert Fulfillment Guidance
The Inventory Turnover Formula
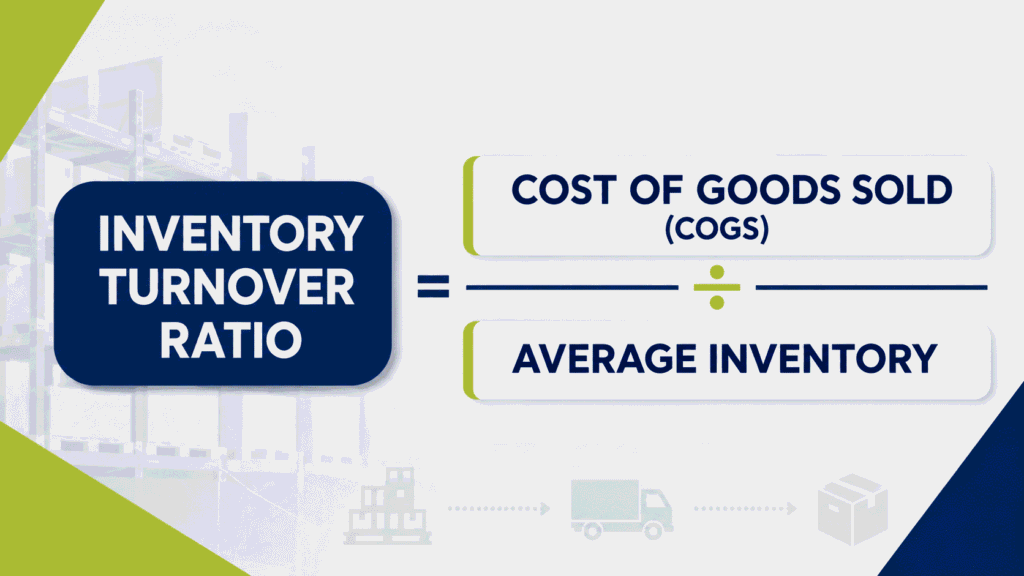
The inventory turnover formula divides the cost of goods sold by the average inventory held over the same period.
➡️ Inventory Turnover Ratio = Cost of Goods Sold (COGS) ÷ Average Inventory
The two inputs come from standard financial statements:
- Cost of goods sold captures the direct costs of producing or purchasing the goods sold (materials, labor, and freight-in) and appears on the income statement. Indirect costs such as marketing or office overhead stay out.
- Average inventory is calculated by adding your inventory value at the start of the period to your inventory value at the end, then dividing by two. This gives a more balanced view instead of relying on one point in time. For seasonal businesses, using the average of all twelve monthly inventory values can give a more accurate picture.
How To Calculate Inventory Turnover Ratio
The calculation takes three steps, and the same steps show how to find inventory turnover ratio values for any period using two financial statements.
- Pull COGS from the income statement for the period being measured; typically a fiscal year or a rolling twelve months.
- Average the inventory: add the beginning and ending inventory values from the balance sheet and divide by two.
- Divide COGS by average inventory. The result is the number of turns for the period.
➡️ To convert the result into days, divide 365 by the ratio. This produces days sales of inventory (DSI); the average number of days a unit sits in stock before it sells.
Inventory Turnover Ratio Example
A DTC home-goods brand posts $600,000 in COGS for the year. Inventory stood at $90,000 on January 1 and $110,000 on December 31, so average inventory is $100,000. The full inventory turnover ratio formula calculation runs:
$600,000 ÷ $100,000 = 6.0 turns
The brand sold and replaced its average stock six times during the year, and DSI works out to roughly 61 days (365 ÷ 6). Whether that is good depends entirely on what comparable businesses achieve, which is where benchmarks come in.
What Does Inventory Turnover Tell You?
Read correctly, the ratio reveals how well demand, purchasing, and execution line up, and in which direction they are drifting.
What A High Inventory Turnover Ratio Means
A high number generally signals strong sales, disciplined buying, and limited exposure to dead stock. Less capital sits in storage, carrying costs stay contained, and the business is less likely to rely on discounts to clear unsold products.
Retailers built for velocity, like fast fashion, for example, run deliberately short production cycles precisely to keep turns high and shelves fresh. Pushed too far, however, a high ratio becomes a warning, because thin stock triggers stockouts, backorders, and expedited freight costs that erode the very margin lean inventory was supposed to protect.
What A Low Inventory Turnover Ratio Means
A low number usually points to overbuying, forecast misses, or products that no longer match demand. Capital gets trapped, storage bills grow, and obsolescence risk compounds. Common responses include targeted promotions, reduced order quantities on slow sellers, and phasing out low-demand SKUs.
Context matters, though. Deliberately holding extra stock ahead of:
- peak season,
- supplier price increases,
- supply disruption likelihood
can be rational. McKinsey’s 2025 survey of global supply chain leaders found that companies built up inventory buffers in response to tariff exposure. Trade coverage points the same way, with analysts expecting a normalization of inventory flows through 2026.
Inventory Turnover Ratio Limitations To Keep In Mind
The ratio is useful, but not 100% sufficient. Four blind spots to account for when reading it:
- Seasonality can distort the result. If the ratio only uses inventory values from the start and end of the period, it may overstate or understate performance for seasonal businesses.
- COGS can change for reasons outside inventory performance. Higher raw material costs, freight rates, or currency shifts can raise or lower the number, even if the business is managing stock the same way.
- Lean inventory can hide expensive trade-offs. The ratio does not capture stockouts, emergency replenishment, or lost sales, so a high turnover number can still mask operational strain.
- Lead times are not reflected in the ratio. If inventory turns quickly but replenishment takes too long, the business may still run out of stock before the next shipment arrives.
How To Convert Inventory Turnover Into Days
As discussed, inventory turnover tells you how many times stock moves in a period. Days sales of inventory shows the same idea in days. Divide 365 by the turnover ratio to estimate how long inventory sits before it sells.
DSI = 365 ÷ Inventory Turnover Ratio
A ratio of 7 equals about 52 days of inventory on hand. That number helps purchasing and operations teams see whether stock is moving fast enough, sitting too long, or at risk of running out too soon.

What Is A Good Inventory Turnover Ratio?
A good ratio depends on industry, margin structure, and product type. A commonly cited healthy range for many product businesses is 5 to 10 turns per year, but the comparison only means something within the same sector. A grocery chain’s velocity is meaningless as a benchmark for a furniture retailer.
Inventory Turnover Ratio Benchmarks Per Industry
| Industry | Typical Annual Turns |
| Grocery & Perishables | 12+ |
| General Retail | 8-12 |
| Consumer Goods | 5-8 |
| Manufacturing | 4-8 |
| Automotive | 2-5 |
| Luxury & High-Ticket Goods | 1-3 |
Treat these ranges as orientation, not targets. Continuously updated benchmarks compiled from public filings are available from CSIMarket and ReadyRatios, both built on SEC data.
The inventory turnover ratio for retail industry operators tends to sit toward the top of the range because volumes are high and margins thin. Walmart, the scale benchmark for the sector, turned its inventory almost 9.3 times last year (in recent fiscal years).
At the macro level, the same picture shows up inverted in the inventories-to-sales ratio, which compares stock held against monthly sales: Federal Reserve data shows U.S. retailers holding roughly 1.3 months of stock in recent readings, a useful reference point for anyone running retail distribution at scale.
6+1 Tips On How To Improve Inventory Turnover
Improving turnover is mostly a matter of tightening the loop between demand signals and purchasing decisions. Cost pressure makes the work urgent: in Deloitte’s 2026 retail outlook, 95% of retail executives expect rising costs from shifting trade policy.
Six practices consistently move the number:
- Forecast from data, not instinct. Sales history, seasonality, promotions, and channel signals produce far better purchase decisions than gut feel.
- Set reorder points and safety stock deliberately. Calculate them from lead time and demand variability, then revisit as conditions change. Disciplined inventory replenishment methods keep a lean, adaptive loop between stock levels and actual demand.
- Segment SKUs with ABC analysis. A-items deserve close monitoring and frequent reordering; C-items deserve scrutiny for obsolescence before they become dead stock.
- Act on slow movers early. Dead stock rarely appears all at once. It usually starts as a slow-moving SKU that quietly ties up cash, takes up space, and loses relevance. Markdowns, bundles, and channel shifts recover capital faster than waiting for demand that may never return.
- Shorten supplier lead times. Faster, more reliable replenishment means less stock needs to be held at all. Dual-sourcing critical SKUs reduces the buffer required for supplier risk.
- Give operations real-time visibility. Cycle counts and a capable warehouse management system (WMS) keep records honest, so every purchasing decision starts from accurate numbers.
💡 Extra Tip: Do not rely only on the overall turnover ratio. One average number can hide very different realities. Some products may sell and replenish quickly, while others sit in storage all year.
Build Stronger Inventory Turns With Nimbl
Healthy turnover only holds when the numbers on the dashboard match what happens on the warehouse floor. Nimbl helps you transition into a fulfillment operation where inventory is visible, workflows are defined, and every order has a clear path from stock to shipment.
If your ratio says one thing and your shelves say another, our team can help you close the gap.
Frequently Asked Questions
Is Inventory Turnover Ratio A KPI?
Yes. It is a core inventory management KPI, tracked alongside fill rate, order accuracy, and days sales of inventory. Finance teams use it to gauge working-capital efficiency, while operations teams use it to guide purchasing and replenishment decisions.
Why Do Businesses Calculate Inventory Turnover Ratio?
Businesses calculate inventory turnover to understand how efficiently stock converts into sales. It helps teams spot overbuying, slow-moving SKUs, stockout risk, excess carrying costs, and gaps between demand planning and warehouse execution.
Is 12 A Good Inventory Turnover Ratio?
It depends on the sector. For grocery or fast-moving consumer goods, 12 turns per year is routine. Compare the figure against industry medians and the company’s own trailing performance.
What Does An Inventory Turnover Ratio Of 5 Mean?
A ratio of 5 means the business sold and replaced its average inventory five times during the period, typically a year. That equals roughly 73 days of stock on hand (365 ÷ 5), a healthy pace for many product businesses.
What Does An Inventory Turnover Of 10% Mean?
Turnover is expressed in turns, not percentages, so a 10% figure usually reflects a mislabeled metric. Read literally, it would equal 0.1 turns (stock selling through once per decade), which signals severe overstocking or a calculation error worth investigating.
Is 1.5 A Good Inventory Turnover Ratio?
For most retail and consumer categories, 1.5 turns per year is low and suggests excess stock or weak demand. For high-ticket, low-volume products such as luxury goods or heavy equipment, 1.5 can be entirely normal for the category.
What Is A 4.5 Inventory Turnover Ratio?
A 4.5 ratio means inventory sold through four and a half times in the period. For example, $360,000 in COGS against $80,000 in average inventory produces 4.5 turns; roughly 81 days of stock on hand (365 ÷ 4.5).